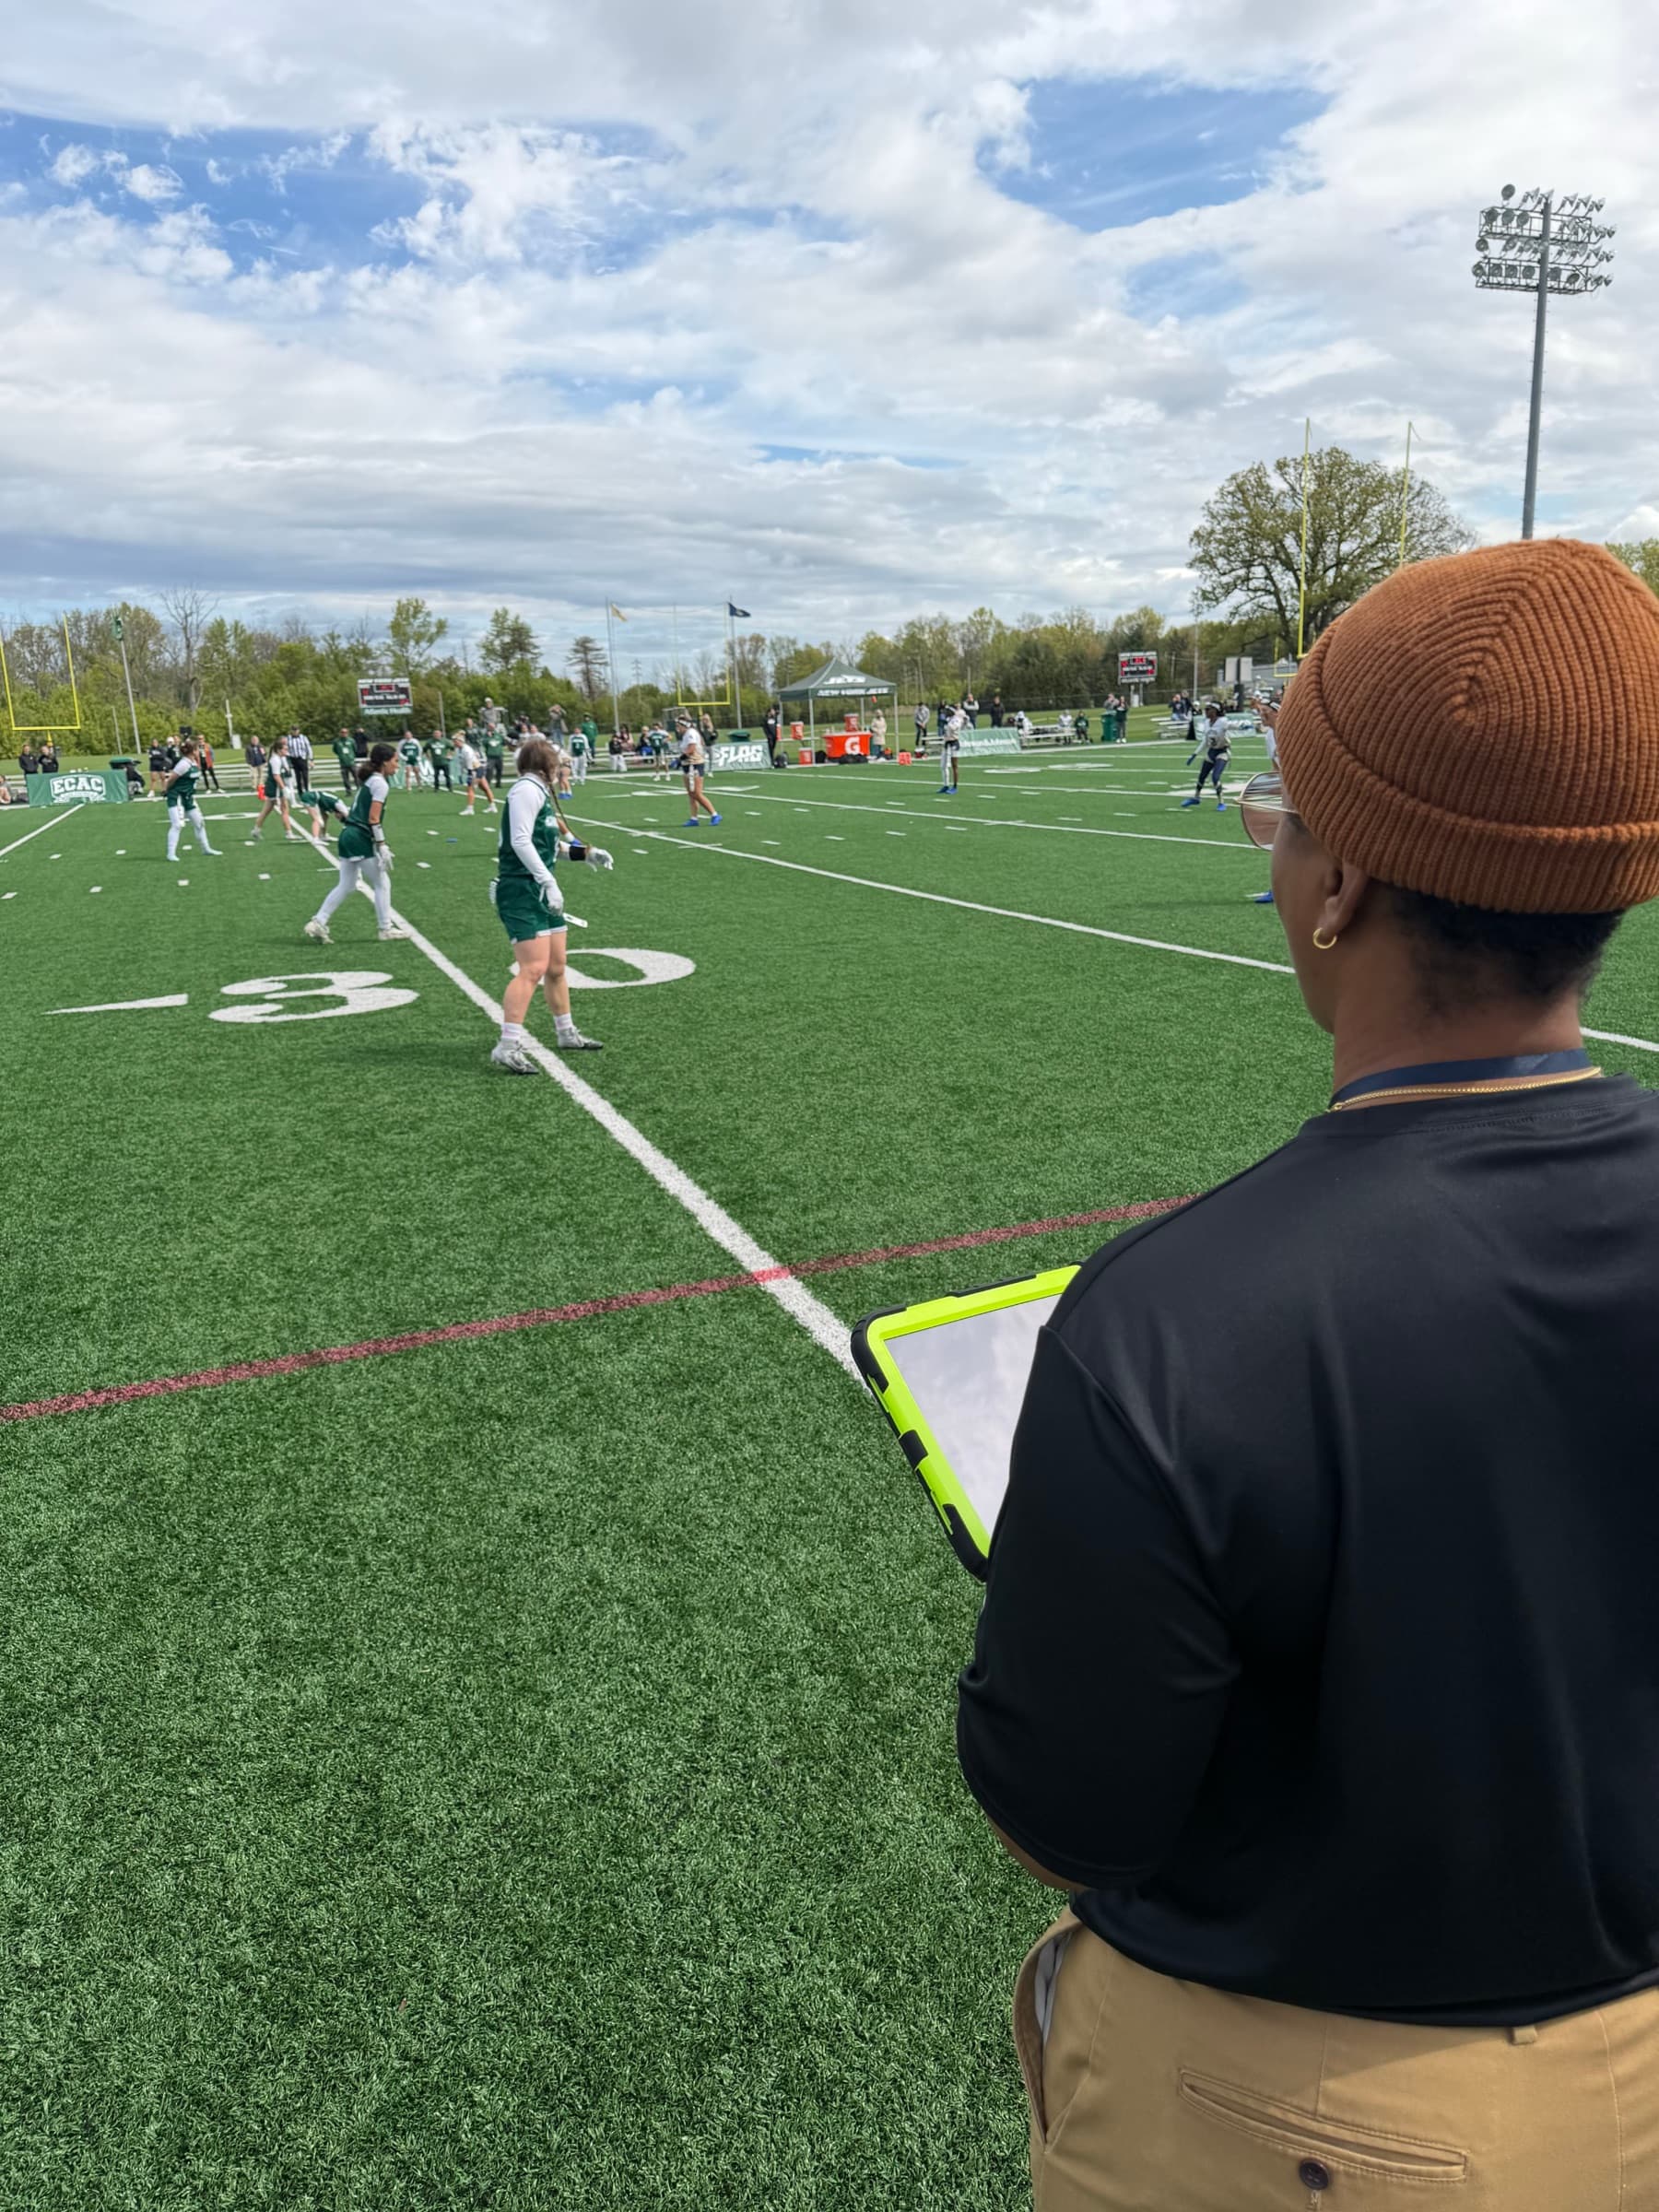
Every tool on the stat sheet
Live tracking, leaderboards, exports, and player visibility, built from the ground up for flag football, with full tackle support.
Know the game
as it happens.
Completion rates, sacks, flag pulls, and scoring update with every play, so coaches can adjust before halftime, not after the season.
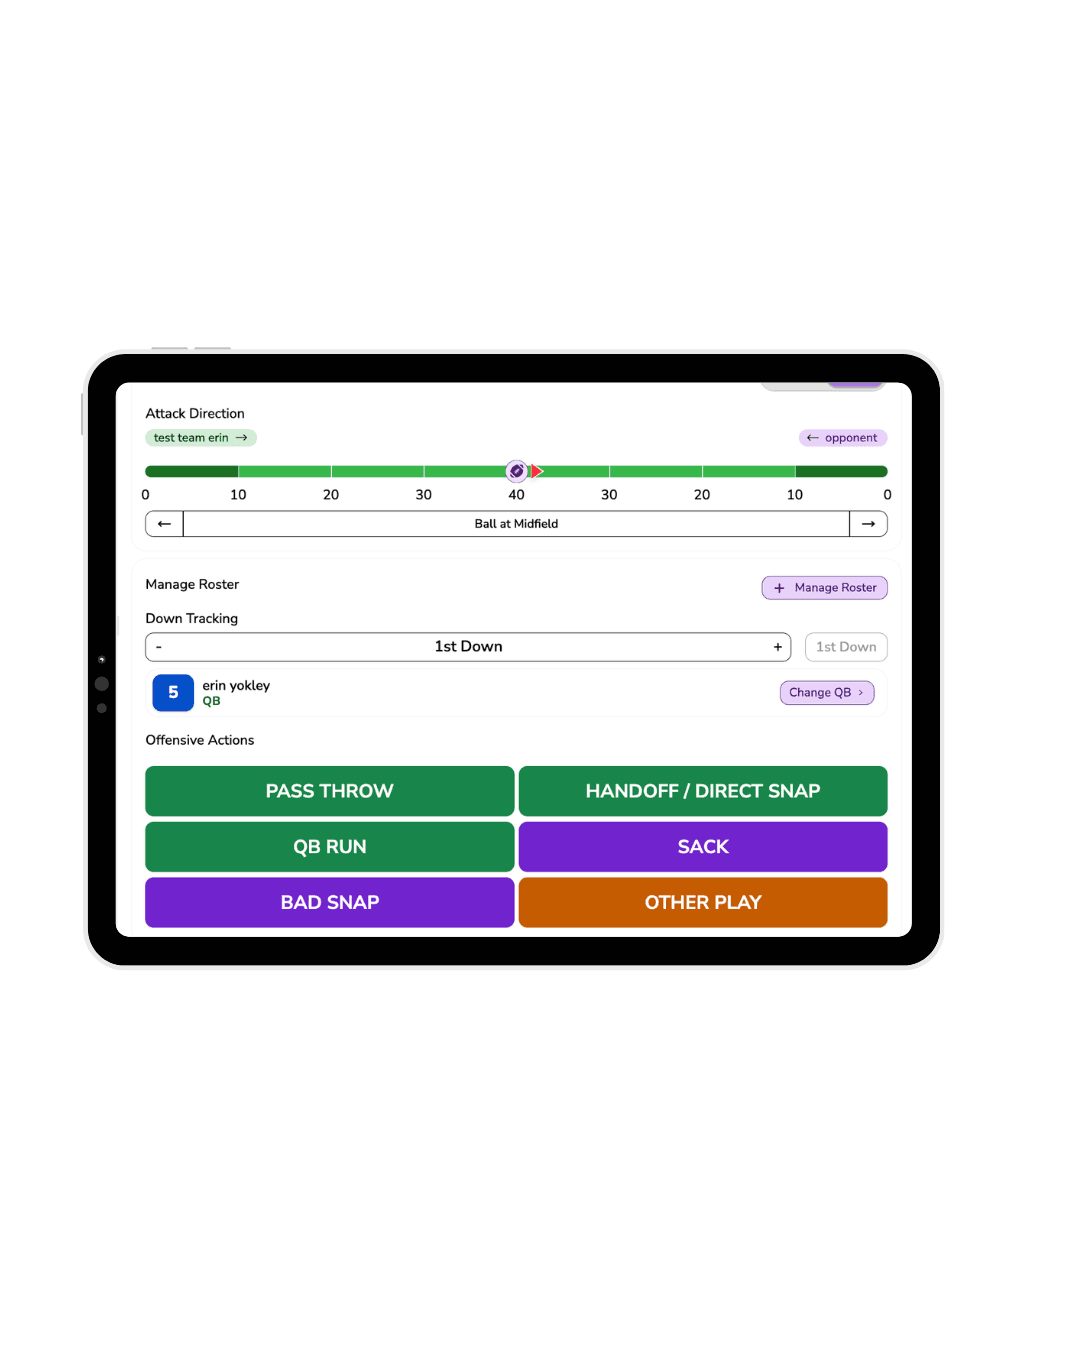
Live Game Tracking
One-tap play buttons for passes, runs, sacks, and snaps. Track field position and downs with full yardage, or switch to stats-only for a faster sideline workflow.
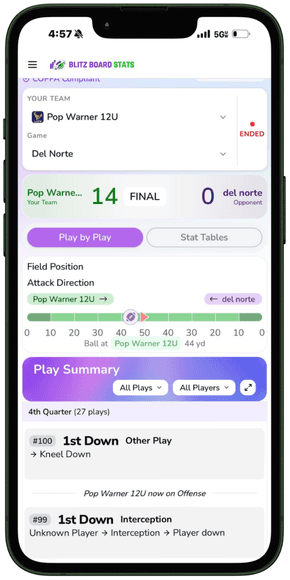
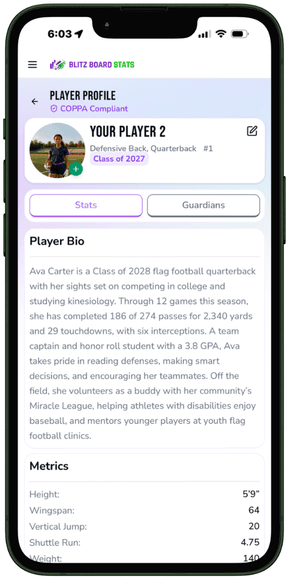
Fan & Family Viewing
Keep your community connected wherever they are. Give fans and families a place to follow live game stats and explore team and player performance.
Season Analytics & Leaderboards
Turn individual games into a clearer picture of performance. Review game and season stats, follow player progress, and recognize contributions across your roster.
Quarterback leadersSample data
View and compare quarterback performance · Sorted by Total Passing Yards, highest first
Stats reflect games where players actively contributed, not just rostered.
| Rank | Player | Total Passing Yards | Completion % | QB Games | Pass Attempts | Completions | Incomplete Passes | Pass Yards/G | Longest Pass | QB Rush Yards | QB Rush Long | QB Runs | Total QB Yards | Passing TD | QB Rush TD | Sacks Taken | INT Thrown | XP 1 | XP 1 Att | XP 2 | XP 2 Att | XP 3 | XP 3 Att | QB Points |
|---|---|---|---|---|---|---|---|---|---|---|---|---|---|---|---|---|---|---|---|---|---|---|---|---|
| 1 | Player 1 | 2486 | 68.6% | 14 | 312 | 214 | 98 | 177.6 | 68 | 412 | 38 | 61 | 2898 | 31 | 4 | 9 | 7 | 6 | 8 | 9 | 13 | 2 | 4 | 54 |
| 2 | Player 2 | 2203 | 65.9% | 13 | 287 | 189 | 98 | 169.5 | 72 | 286 | 29 | 47 | 2489 | 26 | 3 | 11 | 9 | 5 | 7 | 8 | 12 | 1 | 3 | 42 |
| 3 | Player 3 | 1954 | 63.4% | 12 | 265 | 168 | 97 | 162.8 | 61 | 355 | 44 | 52 | 2309 | 22 | 5 | 7 | 8 | 4 | 6 | 7 | 10 | 1 | 2 | 51 |
| 4 | Player 4 | 1712 | 61.8% | 12 | 241 | 149 | 92 | 142.7 | 58 | 198 | 24 | 39 | 1910 | 19 | 2 | 12 | 10 | 3 | 5 | 6 | 9 | 0 | 2 | 27 |
| 5 | Player 5 | 1528 | 58.8% | 11 | 226 | 133 | 93 | 138.9 | 55 | 264 | 31 | 44 | 1792 | 17 | 3 | 8 | 9 | 4 | 5 | 5 | 8 | 1 | 1 | 35 |
| 6 | Player 6 | 1346 | 59.1% | 10 | 198 | 117 | 81 | 134.6 | 63 | 151 | 22 | 28 | 1497 | 14 | 1 | 10 | 7 | 2 | 4 | 4 | 7 | 0 | 1 | 16 |
| 7 | Player 7 | 1129 | 55.5% | 11 | 182 | 101 | 81 | 102.6 | 49 | 307 | 41 | 49 | 1436 | 12 | 4 | 9 | 11 | 3 | 4 | 3 | 6 | 1 | 2 | 36 |
| 8 | Player 8 | 958 | 57.5% | 9 | 160 | 92 | 68 | 106.4 | 52 | 122 | 19 | 23 | 1080 | 10 | 1 | 6 | 6 | 2 | 3 | 3 | 5 | 0 | 1 | 14 |
| 9 | Player 9 | 791 | 55.2% | 8 | 134 | 74 | 60 | 98.9 | 44 | 93 | 17 | 18 | 884 | 8 | 1 | 8 | 7 | 1 | 2 | 2 | 4 | 0 | 0 | 11 |
| 10 | Player 10 | 612 | 51.8% | 7 | 112 | 58 | 54 | 87.4 | 41 | 176 | 27 | 25 | 788 | 6 | 2 | 5 | 5 | 1 | 2 | 1 | 3 | 0 | 1 | 15 |
Swipe for more stats
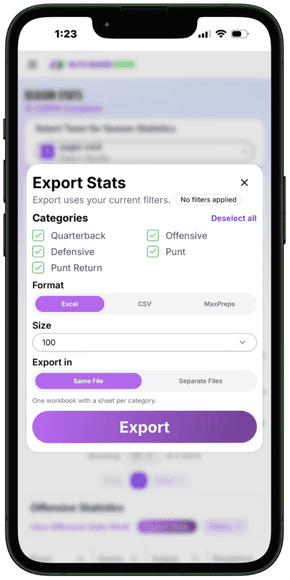
Stats Export & Reporting
Put your stats to work beyond BBS. Export to CSV, Excel, or XML for reporting, or straight to MaxPreps, without re-entering the numbers you've already tracked.
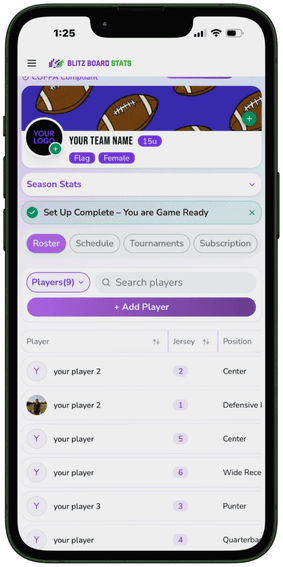
Team & Player Management
Keep rosters, schedules, and player profiles organized in one place. Give coaches, athletes, and families access to the information that matters to them.
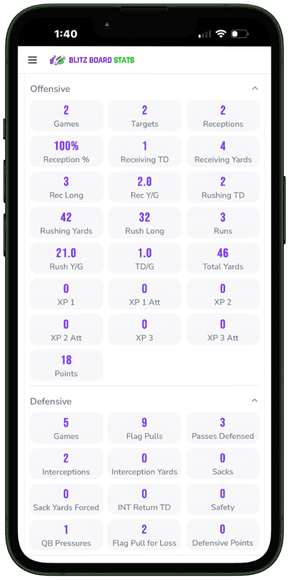
Athlete Stats History
View and filter all your stats across seasons and teams, and follow your progress on your player profile.
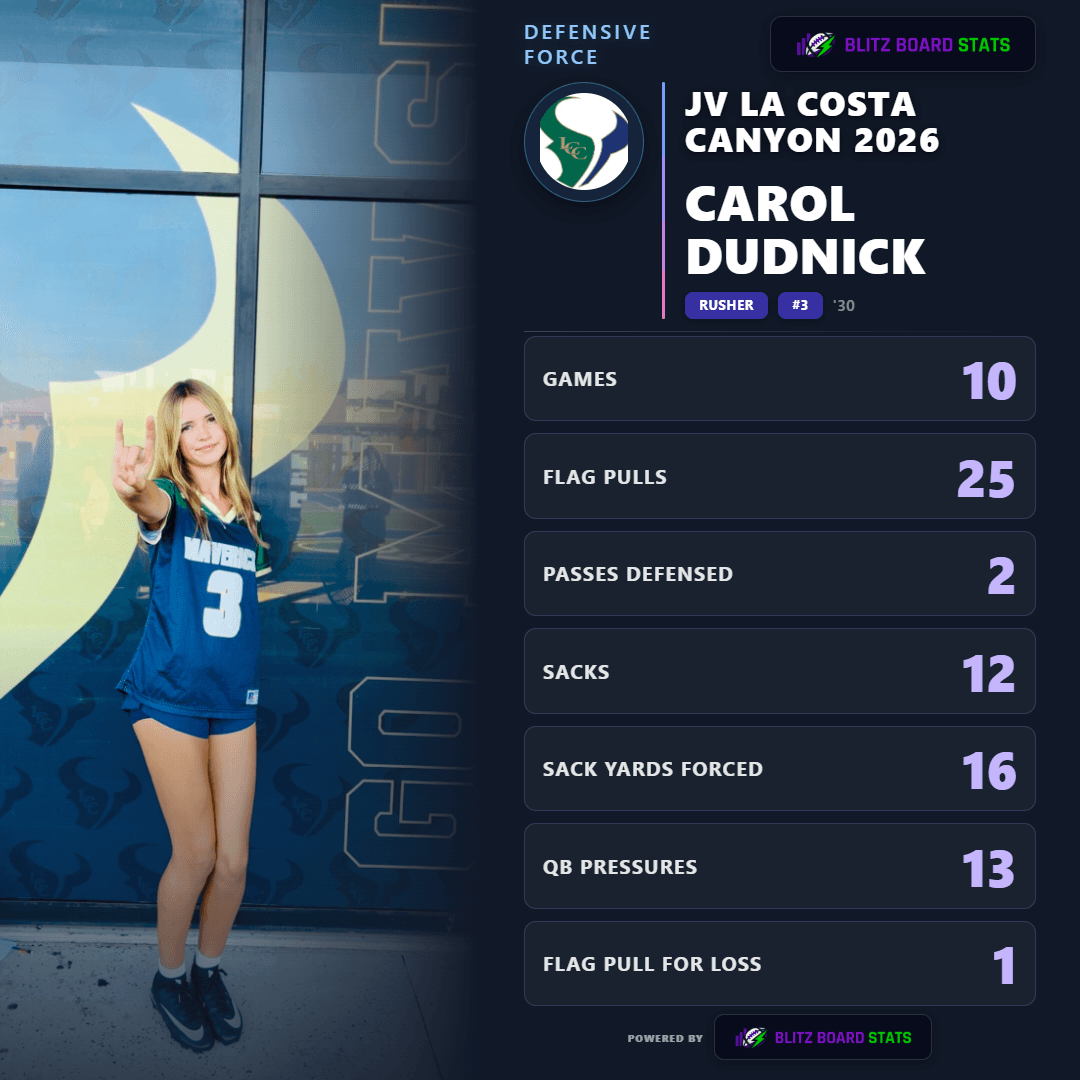
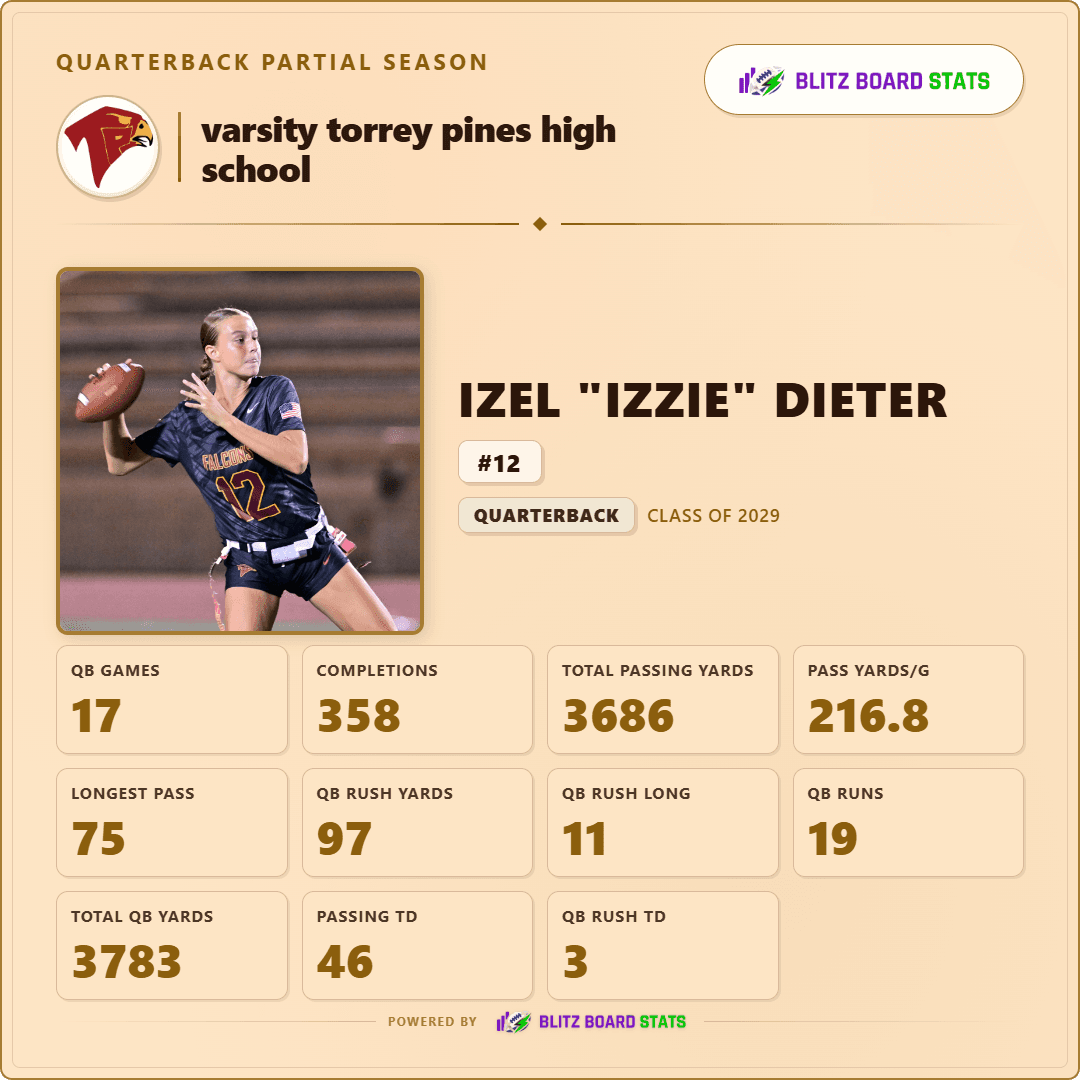
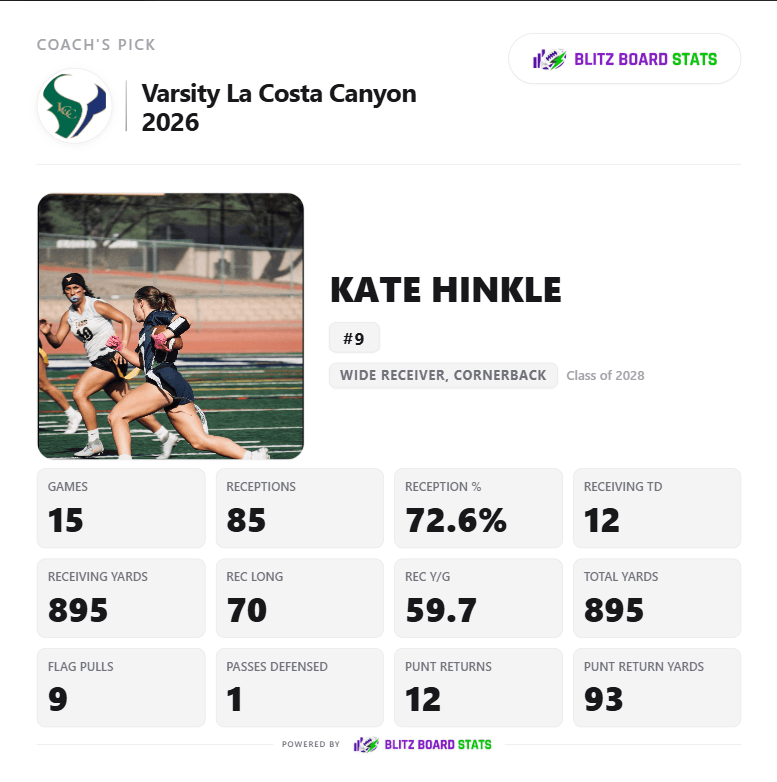
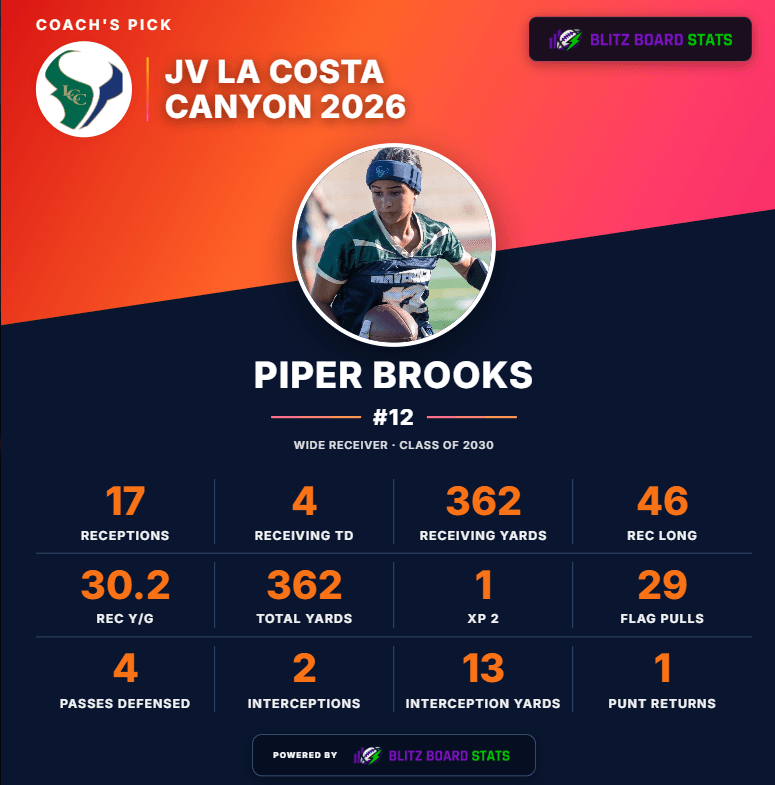
Shareable Player Stat Cards
Celebrate athlete performance with player cards featuring stats from a single game, tournament, or season, ready to share on social media.
Privacy and Guardian Controls
COPPA-compliant design with age-based data protection and privacy logic.
The whole
stat book.
Flag football has its own stat sheet. BBS records all of it for every player in every game, from flag pulls for loss to 3-point tries, then rolls it into season and career totals.
Passing
- Pass Attempts
- Completions
- Completion %
- Total Passing Yards
- Passing TD
- Longest Pass
- Pass Yards/G
- INT Thrown
- Sacks Taken
- QB Rush Yards
Rushing & receiving
- Runs
- Rushing Yards
- Rush Long
- Rushing TD's
- Targets
- Receptions
- Reception %
- Receiving Yards
- Rec Long
- Receiving TD's
Defense
- Flag Pulls
- Flag Pull for Loss
- Sacks
- Sack Yards Forced
- QB Pressures (Hurries)
- Passes Defensed
- Interceptions
- Interception Yards
- INT Return TD
- Safety
Special teams
- Total Punts
- Total Punting Yards
- Average Punt Yards
- Longest Punt (Yds)
- Punts Inside 20
- Punt Returns
- Punt Return Yards
- Longest Punt Return
- Touchdown Returns
- Muffed Punts
Scoring
- XP 1
- XP 1 Att
- XP 2
- XP 2 Att
- XP 3
- XP 3 Att
- Points
- QB Points
- Defensive Points
- Total Points
Built for the sideline
Weak signal, no lost plays
Plays logged while the connection drops are saved on the device and sent the moment it comes back.
Any field, any format
4v4 to 11v11, fields from 30 to 100 yards, halves, quarters, or a running clock, with overtime.
Fix it without stopping
Undo the last play, edit any play, or insert a missed one right where it happened.
An API for your program
Pull teams, players, schedules, and stats into your own tools with an organization API key.
Special teams built in
Guided punting and return flows log punts, returns, touchbacks, and muffs with the yard line.
Your data, your way
Export season stats and leaderboards to CSV, Excel, or XML, or send a game to MaxPreps.
See it live.
Your first game is free.
Build your roster, run a free practice game, and track your first real game on us. No card, no commitment.